Smarties Group Circle Graph 6R 201_
Name ___________________#__
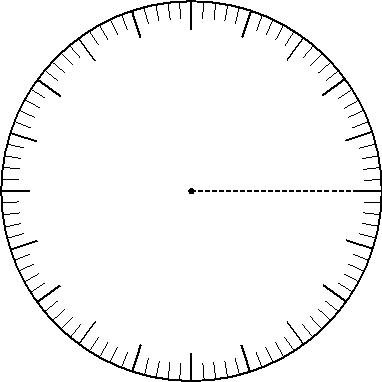
Create a Circle Graph for the average of Blue Birds's group boxes of Smarties
(50g). Use the chart, it has been worked out for you. Remember to order the
sectors from greatest to least,
starting at the dotted line and
progressing clockwise.
|
|
||||||||||||||||||||||||||||||||||||||
|
|
|
Smarties pg 9