Stem and Leaf Plot 6R
A stem and leaf plot looks something like a bar
graph. Each number in the data is broken down into a stem and a leaf, thus the
name. The stem of the number includes all but the last digit. The leaf of
the number will always be a single digit.
Elements of a good stem and leaf plot
-shows the first digits of the number (thousands, hundreds or tens) as the stem
and shows the last digit (ones) as the leaf.
-usually uses whole numbers. Anything that has a
decimal point is rounded to the nearest whole number. For example, test
results, speeds, heights, weights, etc.
-looks like a bar graph when it is turned on its side.
-shows how the data are spread—that is, highest number,
lowest number, most common number and outliers (a number that lies outside the
main group of numbers).
Tips on how to draw a stem and leaf plot
Once you have decided that a stem and leaf plot is the best way to show your
data, draw it as follows:
-On the left hand side of the page, write down the thousands, hundreds or tens
(all digits but the last one). These will be your stems.
-Draw a line to the right of these stems.
-On the other side of the line, write down the ones (the last digit of a
number). These will be your leaves.
For example, if the observed value is 25, then the stem is 2 and the leaf is
the 5. If the observed value is 369, then the stem is 36 and the leaf is 9.
Where observations are accurate to one or more decimal places, such as 23.7,
the stem is 23 and the leaf is 7. If the range of values is too great, the
number 23.7 can be rounded up to 24 to limit the number of stems.
Example 1 – Making a stem and leaf plot
Each morning, a teacher quizzed his class with 20 geography questions. The
class marked them together and everyone kept a record of their personal scores.
As the year passed, each student tried to improve his or her quiz marks. Every
day, Elliot recorded his quiz marks on a stem and leaf plot. This is what his
marks looked like plotted out:
Table 1. Elliot's scores on the basic facts quiz last year Stem Leaf
|
0 |
3 |
6 |
5 |
|
|
|
|
|
|
|
|
|
|
1 |
0 |
1 |
3 |
4 |
5 |
5 |
6 |
6 |
7 |
8 |
9 |
9 |
|
2 |
0 |
0 |
0 |
0 |
|
|
|
|
|
|
|
|
Double Stem and Leaf Plots
Double stem and leaf plots are used to compare two distributions side-by-side.
This type of double stem and leaf plot contains three columns, each separated
by a vertical line. The center column contains the stems. The first and third
columns each contain the leaves of a different distribution. The numbers for
the leaves of the distribution in the leftmost column are aligned to the right
and are listed in order.
Stem-and-leaf plots are not restricted to 2-digit numbers. As well, a double
stem and leaf plot is possible.
Example 2 - Making a double stem and leaf plot
The data:
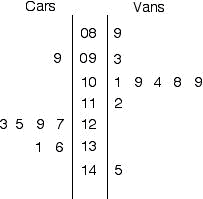
Cars: 123, 125, 129, 131, 127, 99, 136
Vans: 89, 93, 101, 112, 109, 145, 104, 108, 109
A stem-and-leaf plot of this data is:

*Note: the left side data may also be listed in order with the smallest against
the stem and increasing as it goes left, right side always goes from smallest to
largest going left to right.
Legend: A stem and leaf plot and a double stem and leaf plot should include a legend to give the value of the stem and leaves.
| 5 | 3 = 53 7 | 8 | = 87 |1.2 | 2 = 1.22
Example 3 - Making a double stem and leaf plot
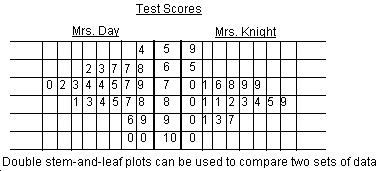
The following is an example of a double
stem-and-leaf plot showing the test scores for two classrooms on a common test.
The test scores were put in order and entered into the graph. All scores are
entered. Mrs.Day's class had scores from 54 to 100
and Mr. Knight's class had scores from 59 to 100.

Important Points about Stem-And-Leaf Plots:
1. Each number in the data set is represented by a leaf placed in a row
beside a stem.
2. The stems are determined by the greater place value(s).
3. The data values by the stem are in order vertically, usually from the least
to the greatest (like you would number down a page).
4. The data values within each stem (the leaves) are in order horizontally. (like you would number across a page).
5. If there is no data for a stem, the stem is still included with no data
values (leaves) recorded beside it.
6. It is important to include a concise but meaningful title to help the reader
understand the graph.