Year
Double Bar Graph
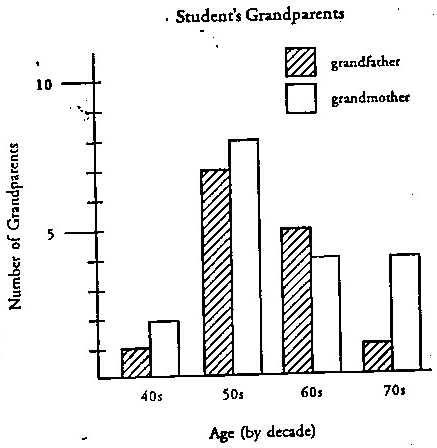
A double bar graph is uses sets of two bars, each representing a different yet related item (data), which abut (touch) and are differentiated in some way (usually by colour or shading).

Bar Graph
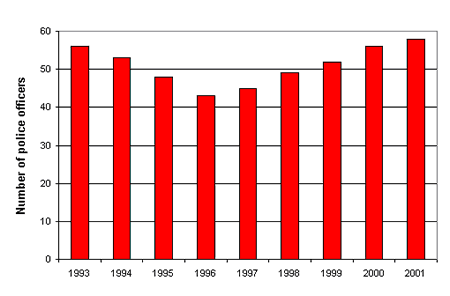
Bar graphs use bars to represent data. They have a title describing what the graph is about and have an x-axis and y-axis title to tell what each represents.
Number of Policemen in Crimeville 1993 to 2001

Year
Double Bar Graph
A double bar graph is uses sets of two bars, each representing a different yet related item (data), which abut (touch) and are differentiated in some way (usually by colour or shading).
