Have you wondered if height is related to arm span? Is there a relationship? In this activity, you will discover the answer to this question!
As you grew in height, do you think your arm span changed?
Explain your prediction.
Height vs. Arm Span 6R Activity #1
Name________________________ #______Part A -
Introduction|
Have you wondered if height is related to arm span? Is there a relationship? In this activity, you will discover the answer to this question! As you grew in height, do you think your arm span changed?
Explain your prediction.
|
|
Part B –
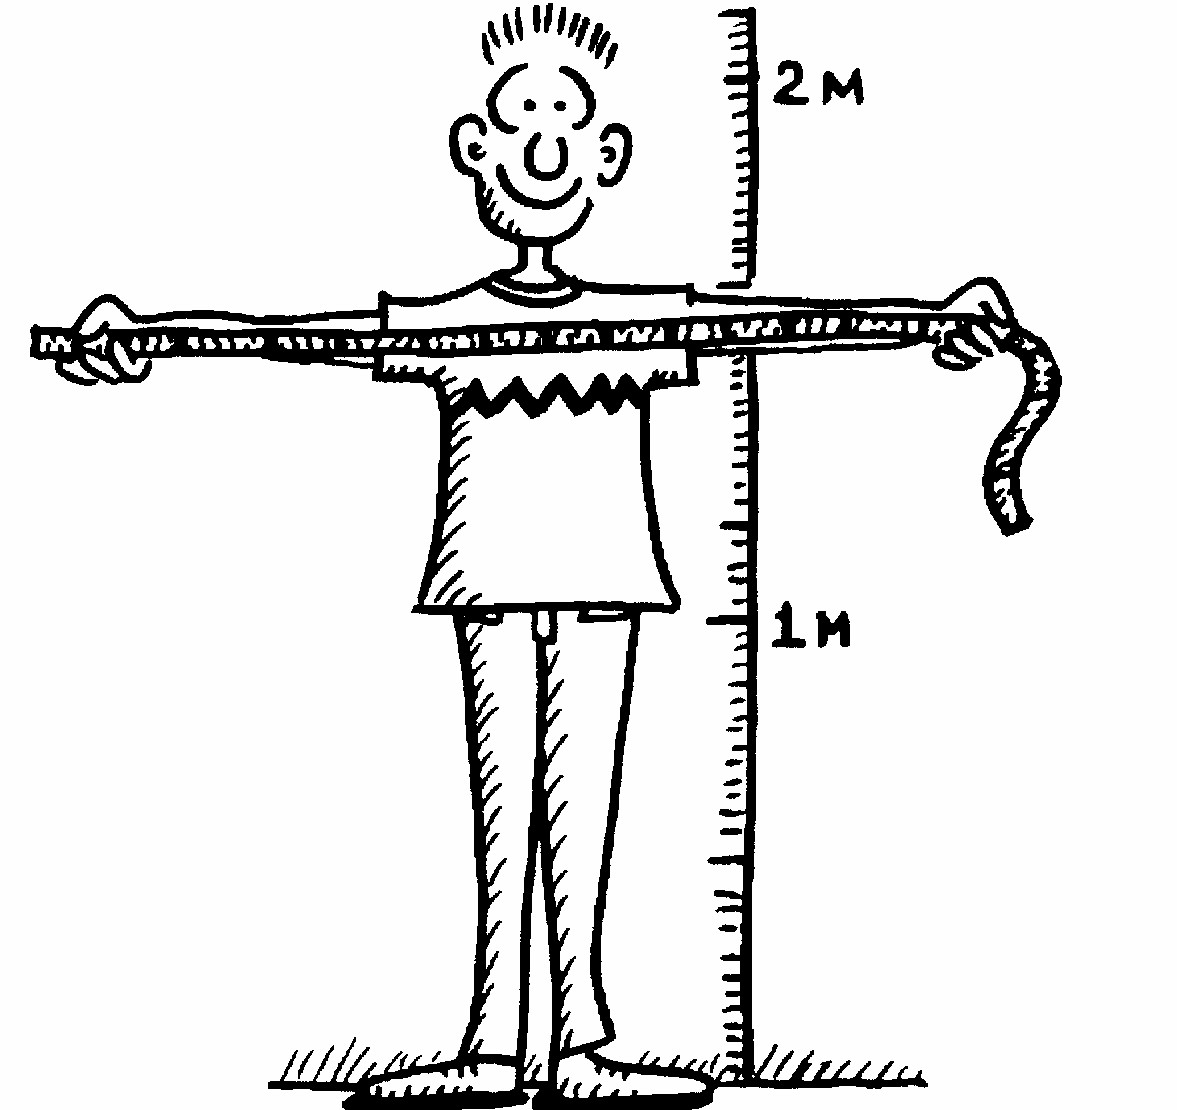
Collecting Individual DataWith a partner and a tape measure, measure each of your arm spans and heights in centimeters (to the nearest half-centimeter).
Record your information in the table below:
| Name
|
Height (cm) | Arm Span (cm) |
|
|
||
|
|
Part C –
Collecting Class Data 6R 201__/ 201__After your teacher has collected the class data, record the information in the table below.
|
|
||||||||||||||||||||||||||||||||||||||||||||||||||||||||||||||||||||||||||||||||||||||||||||||||
|
|||||||||||||||||||||||||||||||||||||||||||||||||||||||||||||||||||||||||||||||||||||||||||||||||
|
Part D - Organizing the Data
When you have two sets of data, it is called BIVARIANT data. Organize the data into a scatter plot (Height on the x-axis and Arm Span on the y-axis). Be as accurate as possible when plotting the points. Then, using a ruler, very neatly, draw in an "X=Y Line" and a" Line of Best Fit", and label them (see sections E and F for help with this). Also in the rubric give the trend as positive, negative, or no trend.
Scatter Plot Activity 6R Name ________________________ #____
Plot the points from the Height - Arm Span chart in Part C. Then draw in the X=Y Line and the Line of Best Fit. Label the trend
|
|
|
|
|
|
|
|
|
|
|
|
|
|
|
|
|
|
|
|
|
|
|
|
|
|
|
|
|
|
|
|
|
|
|
|
|
|
|
|
|
|
|
|
|
|
|
|
|
|
|
|
|
|
|
|
|
|
|
|
|
|
|
|
|
|
|
|
|
|
|
|
|
|
|
|
|
|
|
|
|
|
|
|
|
|
|
|
|
|
|
|
|
|
|
|
|
|
|
|
|
|
|
|
|
|
|
|
|
|
|
|
|
|
|
|
|
|
|
|
|
|
|
|
|
|
|
|
|
|
|
|
|
|
|
|
|
|
|
|
|
|
|
|
|
|
|
|
|
|
|
|
|
|
|
|
|
|
|
|
|
|
|
|
|
|
|
|
|
|
|
|
|
|
|
|
|
|
|
|
|
|
|
|
|
|
|
|
|
|
|
|
|
|
|
|
|
|
|
|
|
|
|
|
|
|
|
|
|
|
|
|
|
|
|
|
|
|
|
|
|
|
|
|
|
|
|
|
|
|
|
|
|
|
|
|
|
|
|
|
|
|
|
|
|
|
|
|
|
|
|
|
|
|
|
|
|
|
|
|
|
|
|
|
|
|
|
|
|
|
|
|
|
|
|
|
|
|
|
|
|
|
|
|
|
|
|
|
|
|
|
|
|
|
|
|
|
|
|
|
|
|
|
|
|
|
|
|
|
|
|
|
|
|
|
|
|
|
|
|
|
|
|
|
|
|
|
|
|
|
|
|
|
|
|
|
|
|
|
|
|
|
|
|
|
|
|
|
|
|
|
|
|
|
|
|
|
|
|
|
|
|
|
|
|
|
|
|
|
|
|
|
|
|
|
|
|
|
|
|
|
|
|
|
|
|
|
|
|
|
|
|
|
|
|
|
|
|
|
|
|
|
|
|
|
|
|
|
|
|
|
|
|
|
|
|
|
|
|
|
|
|
|
|
|
|
|
|
|
|
|
|
|
|
|
|
|
|
|
|
|
|
|
|
|
|
|
|
|
|
|
|
|
|
|
|
|
|
|
|
|
|
|
|
|
|
|
|
|
|
|
|
|
|
|
|
|
|
|
|
|
|
|
|
|
|
|
|
|
|
|
|
|
|
|
|
|
|
|
|
|
|
|
|
|
|
|
|
|
|
|
|
|
|
|
|
|
|
|
|
|
|
|
|
|
|
|
|
|
|
|
|
|
|
|
|
|
|
|
|
|
|
|
|
|
|
|
|
|
|
|
|
|
|
|
|
|
|
|
|
|
|
|
|
|
|
|
|
|
|
|
|
|
|
|
|
|
|
|
|
|
|
|
|
|
|
|
|
|
|
|
|
|
|
|
|
|
|
|
|
|
|
|
|
|
|
|
|
|
|
|
|
|
|
|
|
|
|
|
|
|
|
|
|
|
|
|
|
|
|
|
|
|
|
|
|
|
|
|
|
|
|
|
|
|
|
|
|
|
|
|
|
|
|
|
|
|
|
|
|
|
|
|
|
|
|
|
|
|
|
|
|
|
|
|
|
|
|
|
|
|
|
|
|
|
|
|
|
|
|
|
|
|
|
|
|
|
|
|
|
|
|
|
|
|
|
|
|
|
|
|
|
|
|
|
|
|
|
|
|
|
|
|
|
|
|
|
|
|
|
|
|
|
|
|
|
|
|
|
|
|
|
|
|
|
|
|
|
|
|
|
|
|
|
|
|
|
|
|
|
|
|
|
|
|
|
|
|
|
|
|
|
|
|
|
|
|
|
|
|
|
|
|
|
|
|
|
|
|
|
|
|
|
|
|
|
|
|
|
|
|
|
|
|
|
|
|
|
|
|
|
|
|
|
|
|
|
|
|
|
|
|
|
|
|
|
|
|
|
|
|
|
|
|
|
|
|
|
|
|
|
|
|
|
|
|
|
|
|
|
|
|
|
|
|
|
|
|
|
|
|
|
|
|
|
|
|
|
|
|
|
|
|
|
|
|
|
|
|
|
|
|
|
|
|
|
|
|
|
|
|
|
|
|
|
|
|
|
|
|
|
|
|
|
|
|
|
|
|
|
|
|
|
|
|
|
|
|
|
|
|
|
|
|
|
|
|
|
|
|
|
|
|
|
|
|
|
|
|
|
|
|
|
|
|
|
|
|
|
|
|
|
|
|
|
|
|
|
|
|
|
|
|
|
|
|
|
|
|
|
|
|
|
|
|
|
|
|
|
|
|
|
|
|
|
|
|
|
|
|
|
|
|
|
|
|
|
|
|
|
|
|
|
|
|
|
|
|
|
|
|
|
|
|
|
|
|
|
|
|
|
|
|
|
|
|
|
|
|
|
|
|
|
|
|
|
|
|
|
|
|
|
|
|
|
|
|
|
|
|
|
|
|
|
|
|
|
|
|
|
|
|
|
|
|
|
|
|
|
|
|
|
|
|
|
|
|
|
|
|
|
|
|
|
|
|
|
|
|
|
|
|
|
|
|
|
|
|
|
|
|
|
|
|
|
|
|
|
|
|
|
|
|
|
|
|
|
|
|
|
|
|
|
|
|
|
|
|
|
|
|
|
|
|
|
|
|
|
|
|
|
|
|
|
|
|
|
|
|
|
|
|
|
|
|
|
|
|
|
|
|
|
|
|
|
|
|
|
|
|
|
|
|
|
|
|
|
|
|
|
|
|
|
|
|
|
|
|
|
|
|
|
|
|
|
|
|
|
|
|
|
|
|
|
|
|
|
|
|
|
|
|
|
|
|
|
|
|
|
|
|
|
|
|
|
|
|
|
|
|
|
|
|
|
|
|
|
|
|
|
|
|
|
|
|
|
|
|
|
|
|
|
|
|
|
|
|
|
|
|
|
|
|
|
|
|
|
|
|
|
|
|
|
|
|
|
|
|
|
|
|
|
|
|
|
|
|
|
|
|
|
|
|
|
|
|
|
|
|
|
|
|
|
|
|
|
|
|
|
|
|
|
|
|
|
|
|
|
|
|
|
|
|
|
|
|
|
|
|
|
|
|
|
|
|
|
|
|
|
|
|
|
|
|
|
|
|
|
|
|
|
|
|
|
|
|
|
|
|
|
Part E-
Analyzing Trend1) What do you notice about the trend of the points on the scatter plot? (Hint: think of uphill and downhill)
When the data points are going uphill, this is called a
positive relationship. When the data points are going downhill, this iscalled a
negative relationship. when the data points are not going uphill or downhill this is called a no relationship. This is called the trend of the data.4) In a positive relationship, as the
x-variable (height) increases, the y-variable (arm span) __________ (increases or decreases).5) In a negative relationship, as the
x-variable increases, what do you think the y-variable will do? ___________ (increase ordecrease)
6) Height and arm span is an example of a __________ relationship. Write a sentence to justify why this is a positive relationship between height and arm span.
7) Was your prediction from Part A about the relationship between these two variables correct? ___________________________
____________________________________________________________________________________________________
____________________________________________________________________________________________________
____________________________________________________________________________________________________
Part F –
Analyzing the y=x line1) Look back at the class data. Was there anyone who had the same height and the same arm span? What were their ordered pairs?
2) What are five other possible ordered pairs where height is the same as arm span?
| Ordered Pairs (x, y) |
3) Plot those points on your scatter plot in a different color. Connect these points and extend to the edge of the graph to form a line.
4) This line is called the
y=x line. Why do you think it is called this?______________________________________________________________________________________________________
______________________________________________________________________________________________________
______________________________________________________________________________________________________
5) Look at several points above the line. What do you notice about the arm span compared to height?
______________________________________________________________________________________________________
______________________________________________________________________________________________________
______________________________________________________________________________________________________
6) Look at several points below the line. What do you notice about the arm span compared to height?
______________________________________________________________________________________________________
______________________________________________________________________________________________________
______________________________________________________________________________________________________
7) The points above the line represent people who…
______________________________________________________________________________________________________
8) The points below the line represent people who…
______________________________________________________________________________________________________
Part G –
Analyzing the Line of Best FitA "Line of Best Fit" is a line that matches the data as best as possible, with an even number of points on both sides of the line. Many points may not fall on the line!
1) Do you think the
y=x line you drew in Part F “fits” the data well? Are there too many points above or below the line? Explain.______________________________________________________________________________________________________
______________________________________________________________________________________________________
______________________________________________________________________________________________________
2) Lay a piece of linguini on your graph and place it where you think it would be the best “fit” line. Justify why you placed it there.
______________________________________________________________________________________________________
______________________________________________________________________________________________________
______________________________________________________________________________________________________
3) In a different color, trace this
line of best fit on your graph. Compare your line of best fit to other students in your class.This graph shows a linear relationship, where the data follows the trend of a line. Not all data follows this trend. We will look at data that does not follow this trend in another activity.
Part H –
Interpreting the DataNow that we have collected, organized, and analyzed the data, what can you conclude about height and arm span?
______________________________________________________________________________________________________
______________________________________________________________________________________________________
______________________________________________________________________________________________________