Stem-And-Leaf Plot
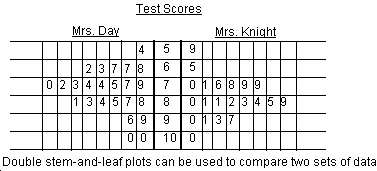
Stem-and-leaf plots are a form of bar graph where numeric data is plotted by using the actual numerals to form the graph. If the data is grouped by tens, list the tens digits in order from least (top) to greatest (bottom) and draw a line to the right side (for a double set of data draw a line down both sides). These form the “stem” of the graph. Write the ones digits nest to the appropriate tens digit from the least (left) to the greatest (right) forming the “leaves”. This is an efficient method of ordering data and individual elements of data can be identified.
The following is an example of a double stem-and-leaf plot showing the test scores for two classrooms on a common test. The test scores were put in order and entered into the graph. All scores are entered. Mrs. Day's class had scores from 54 to 100 and Mr. Knight's class had scores from 59 to 100.
